Team: Vishwa Anand, Dhanush Eashwar, Tanaya Sharma, Vishal Yalla
Topic: Interest Rates, Option 2
Write-Up
Interest Rate effects on Bond Prices, Domestic Investment Spending, Unemployment, Inflation, and Economic Growth (2008-2023)
Question Answers
What happened to bond prices during these time periods?
Further, during periods of low interest rates, that is, 2008-2015 and 2019-2020, there was an upward trend in the prices of bonds. This occurred because bond prices and yields have an inverse relationship: when interest rates contract, existing bonds, with their higher coupon rates, are more desirable. On the other hand, from the period 2015 to 2018 and from 2022 to the present, the bond prices were on the decline since newly issued bonds offered better yields, thus requiring less incentive to hold the lower yielding bonds.
What happened to domestic investment spending during these times periods?
For the past domestic investment spending, low borrowing cost that prevail between 2008 and 2015 and 2019-2020 push businesses and consumers to invest and spend hence boosting domestic investments. At the same time, the increase in borrowing costs from 2015-2018 and from 2022 to the present reduced the attractiveness of investment for businesses and consumers, and thus might have been negative for domestic investment.
What happened to unemployment data during these time periods?
The unemployment rates during these periods also followed trends of the general economy. The unemployment rate hit its high of 10% in October 2009 during the onset of the financial crisis it has been decreasing as the economy improves to reach 5% late 2015. The number of unemployed employees reduced and the unemployment rate hit a low of 3%. The company reduced the portion of temporary staff to 5% in 2019 given that the labour market became more competitive. Nevertheless, the pandemic led to increase in unemployment to 14% which is significantly high than the previous percentage. It fell slightly to 7% in April 2020, but it continued decreasing as the economy restarted its operations. Few unemployment rates have been recorded and these have been below 3% as we estimate for the year 2024. 5% as well as 4% with the key provisos linked to a potential economic deceleration.
What happened to inflation during these time periods?
Inflation rates also demonstrated different patterns over these periods. However, from 2008 up to 2015 period, inflation was relatively low because of slow economic growth and cheap energy. It rose gradually over the period of 2015- 2018 to reach the Federal Reserve’s desired inflation rate of 2% in 2018 due to the attainment of full employment. There was inflation stability in the period of 2019 and up to the first half of 2020 with deflation resulting from the pandemic. While inflation has come down from its recent highs, it is still uncomfortable at 4 percent.” 2% by the end of March, 2024.
What happened to Economic Growth (Real GDP) during these time periods?
Real GDP growth also had different trends as well. Following a decline in the year of recession, the real GDP grew and was averaging 2% per year between 2010 and 2015. Growth increased to approximately 2 percent hence becoming greater than the inflation rate in 2008. From 2016 to 2018, this figure grew at a rate of 5% per annum due to the optimization of tax rates and an increase in government expenses. Real GDP sharply declined in 2020 due to the effects of the pandemic, however, there was considerable growth in 2021 following the relaxation of restrictions. Nevertheless, actual GDP growth has decelerated to a level below 2 percent for 2024 mainly due to the impact of higher interest rates and tighter financial conditions.
Chronological Interest Rate Effects
Signifianct changes in Interest Rates (Reflects Monetary Policy Action Changes)
Interest Rate Cuts (2008-2015)
To counter the financial crisis, the Fed dropped interest rates to near-zero levels in December 2008, maintaining this level until December 2015. This was a period of ultra-low rates, adopted globally to encourage growth and recovery.
- Bond Prices: This caused bond prices to move up because as interest rates decrease, bond yields move inversely. This made bonds more attractive, especially to investors holding them. 1
- Domestic Investment Spending: The relatively low interest rates led businesses and consumers to borrow and spend more for investments, raising domestic investment. 2
- Unemployment: Unemployment escalated to 10% in October 2009 but later declined as the economy improved, reaching 5% in December 2015. 3
- Inflation: Inflation remained low throughout this period, with the Fed unable to hit its 2% target due to weak economic growth and low energy prices. 4
- Economic Growth (Real GDP): After declining during the recession, real GDP growth rebounded but remained modest, averaging around 2% annually from 2010 to 2015. 5
Interest Rate Hikes (2015-2018)
As the economy recovered, the Fed began raising interest rates in December 2015, with several hikes through 2018, bringing the federal funds rate to a range of 2.25%-2.5%.
- Bond Prices: Higher interest rates led to falling bond prices as newly issued bonds offered better yields. 1
- Domestic Investment Spending: Higher rates increased the cost of borrowing, making it more expensive for businesses and consumers to invest and spend, potentially slowing domestic investment. 2
- Unemployment: The unemployment rate fell to a record low of 3.5% in 2019 as the labor market tightened. 3
- Inflation: Inflation gradually increased, reaching the Fed’s 2% target in 2018 as the economy neared full employment. 4
- Economic Growth (Real GDP): Real GDP grew at a faster rate, averaging around 2.5% annually from 2016 to 2018, supported by tax cuts and increased government spending. 5
Interest Rate Cuts (2019-2020)
Amid concerns about global economic slowdowns and trade tensions, the Fed cut interest rates three times in 2019, bringing the federal funds rate to a range of 1.5%-1.75%. In March 2020, the Fed lowered rates to near-zero levels again in response to the COVID-19 pandemic.
- Bond Prices: Lower interest rates led to higher bond prices. 1
- Domestic Investment Spending: Lower borrowing costs aimed to encourage investment and spending, but the pandemic disrupted economic activity. 2
- Unemployment: The unemployment rate spiked to 14.7% in April 2020 due to pandemic-related job losses but gradually declined as the economy reopened. 3
- Inflation: Inflation remained low during this period, with deflationary pressures due to the pandemic. 4
- Economic Growth (Real GDP): Real GDP contracted sharply in 2020 due to the pandemic but rebounded in 2021 as economic activity resumed. 5
Interest Rate Hikes (2022-Present)
Faced with persistently high inflation, the Fed began an aggressive series of interest rate hikes in March 2022, raising the federal funds rate to a range of 5.25%-5.5% by May 2024.
- Bond Prices: Rising interest rates have led to lower bond prices, with investors demanding higher yields on newly issued bonds. 1
- Domestic Investment Spending: Higher borrowing costs have made it more expensive for businesses and consumers to invest and spend, potentially slowing domestic investment. 2
- Unemployment: The unemployment rate has remained low, around 3.5%-4%, as the labor market remains tight despite economic slowdown concerns. 3
- Inflation: Inflation has moderated from its peak but remains elevated, with the Fed’s preferred measure (core PCE) at 4.2% as of March 2024. 4
- Economic Growth (Real GDP): Real GDP growth has slowed, with the economy narrowly avoiding a recession in 2023 but facing ongoing headwinds from higher interest rates and tighter financial conditions. 5
In essence, based on this analysis, it can be stated that the changes in interest rates determined by the Fed has affected the bond yields, the investment expenditures, employment, inflation, and economic growth substantially. On the other hand, low rates were implemented during weaker economic circumstances to spark some kind of vigor.”High rates on the other hand were implemented to curb inflation in a bid to ensure price stability.
FRED DataTables
FRED Data Labels
FEDFUNDS: Federal Funds Effective Rate || Monetary Policy Action Data
GPDI: Gross Private Domestic Investment || Investment Spending Data
RGDP: Real Gross Domestic Product || Real GDP Data
UNRATE: Unemployment Rate || Unemployment Data
INFLATION: Inflation, Consumer Prices || Inflation Data
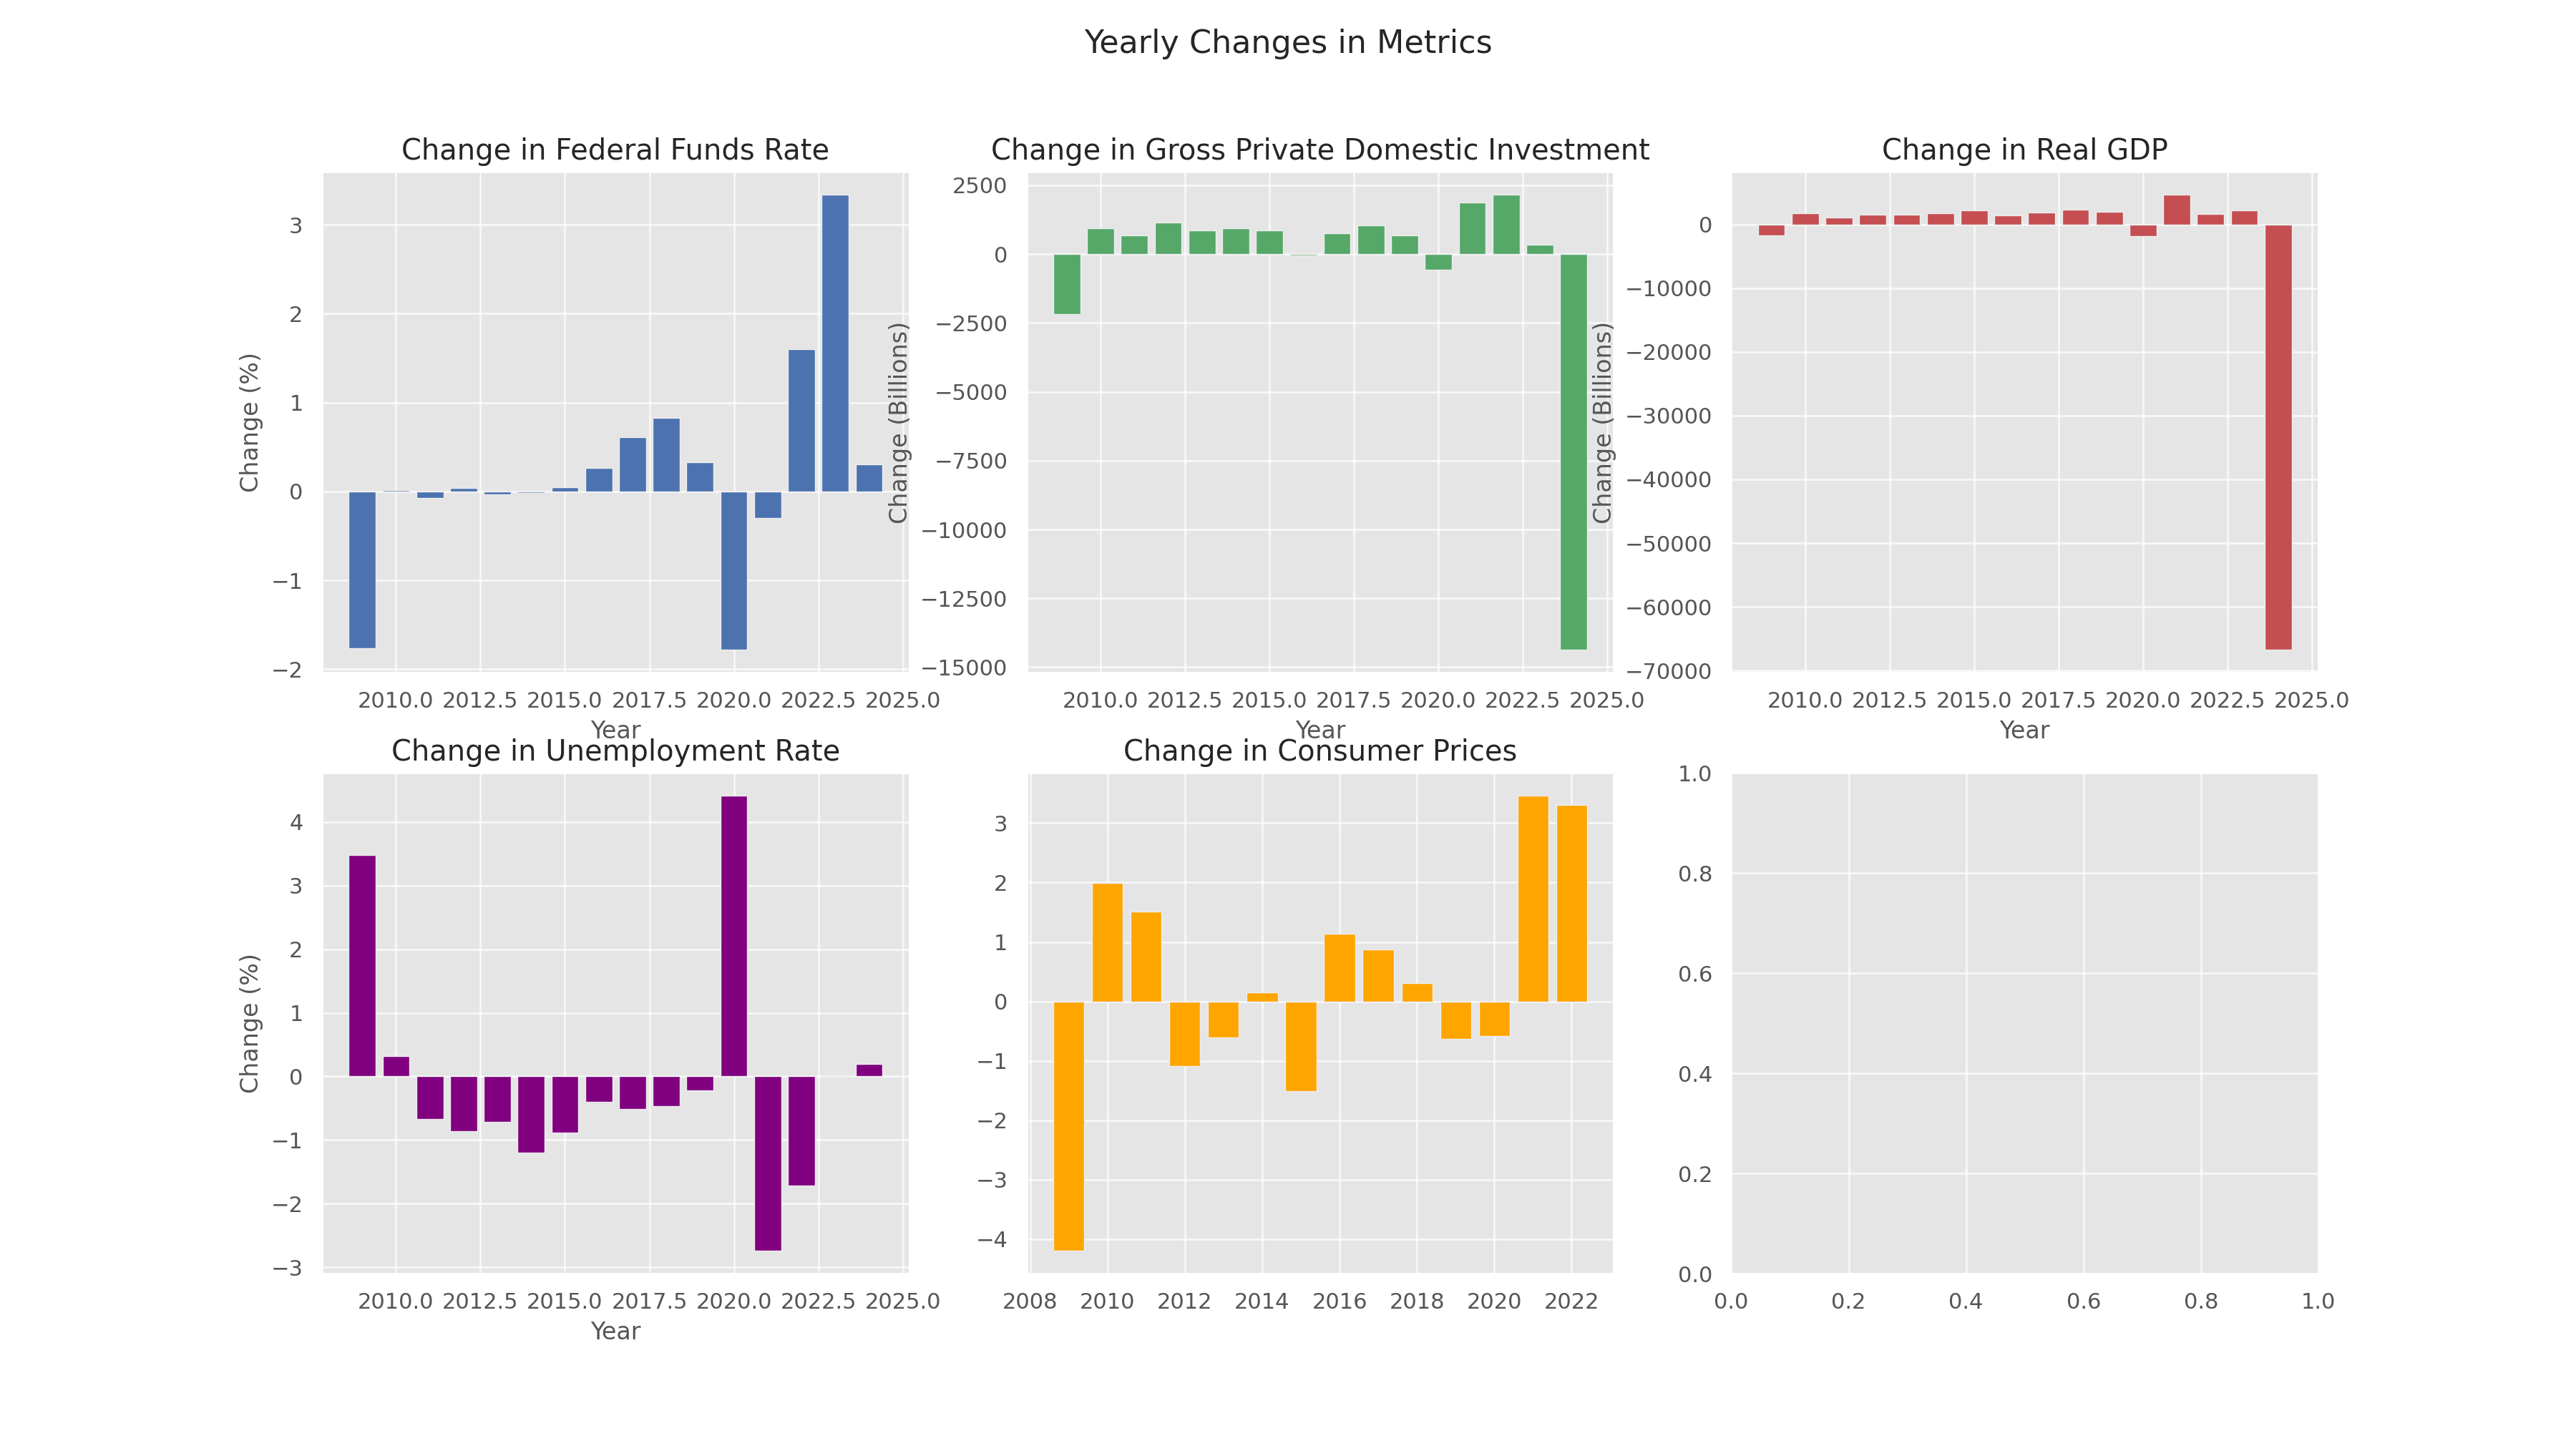
FRED DATA : Annual Changes (Δ)
| YEAR | DATE | FEDFUNDS | GPDI | RGDP | UNRATE | INFLATION |
|---|---|---|---|---|---|---|
| 2009 | 2009-01-01 | -1.768 | -2191.799 | -1729.497 | 3.483 | -4.195 |
| 2010 | 2010-01-01 | 0.015 | 943.237 | 1762.56 | 0.325 | 1.996 |
| 2011 | 2011-01-01 | -0.073 | 668.358 | 1050.64 | -0.675 | 1.517 |
| 2012 | 2012-01-01 | 0.038 | 1156.765 | 1561.395 | -0.858 | -1.088 |
| 2013 | 2013-01-01 | -0.032 | 866.293 | 1477.631 | -0.717 | -0.605 |
| 2014 | 2014-01-01 | -0.018 | 942.617 | 1798.189 | -1.2 | 0.157 |
| 2015 | 2015-01-01 | 0.043 | 858.002 | 2151.631 | -0.883 | -1.504 |
| 2016 | 2016-01-01 | 0.262 | -40.705 | 1368.201 | -0.4 | 1.143 |
| 2017 | 2017-01-01 | 0.607 | 757.436 | 1881.721 | -0.517 | 0.869 |
| 2018 | 2018-01-01 | 0.83 | 1028.425 | 2327.171 | -0.467 | 0.312 |
| 2019 | 2019-01-01 | 0.327 | 670.523 | 1992.766 | -0.217 | -0.63 |
| 2020 | 2020-01-01 | -1.782 | -576.194 | -1832.051 | 4.417 | -0.579 |
| 2021 | 2021-01-01 | -0.296 | 1871.594 | 4694.474 | -2.742 | 3.464 |
| 2022 | 2022-01-01 | 1.603 | 2161.581 | 1657.376 | -1.717 | 3.305 |
| 2023 | 2023-01-01 | 3.341 | 348.991 | 2219.48 | -0.008 | 3.400 |
Graph Annual Changes (Δ)
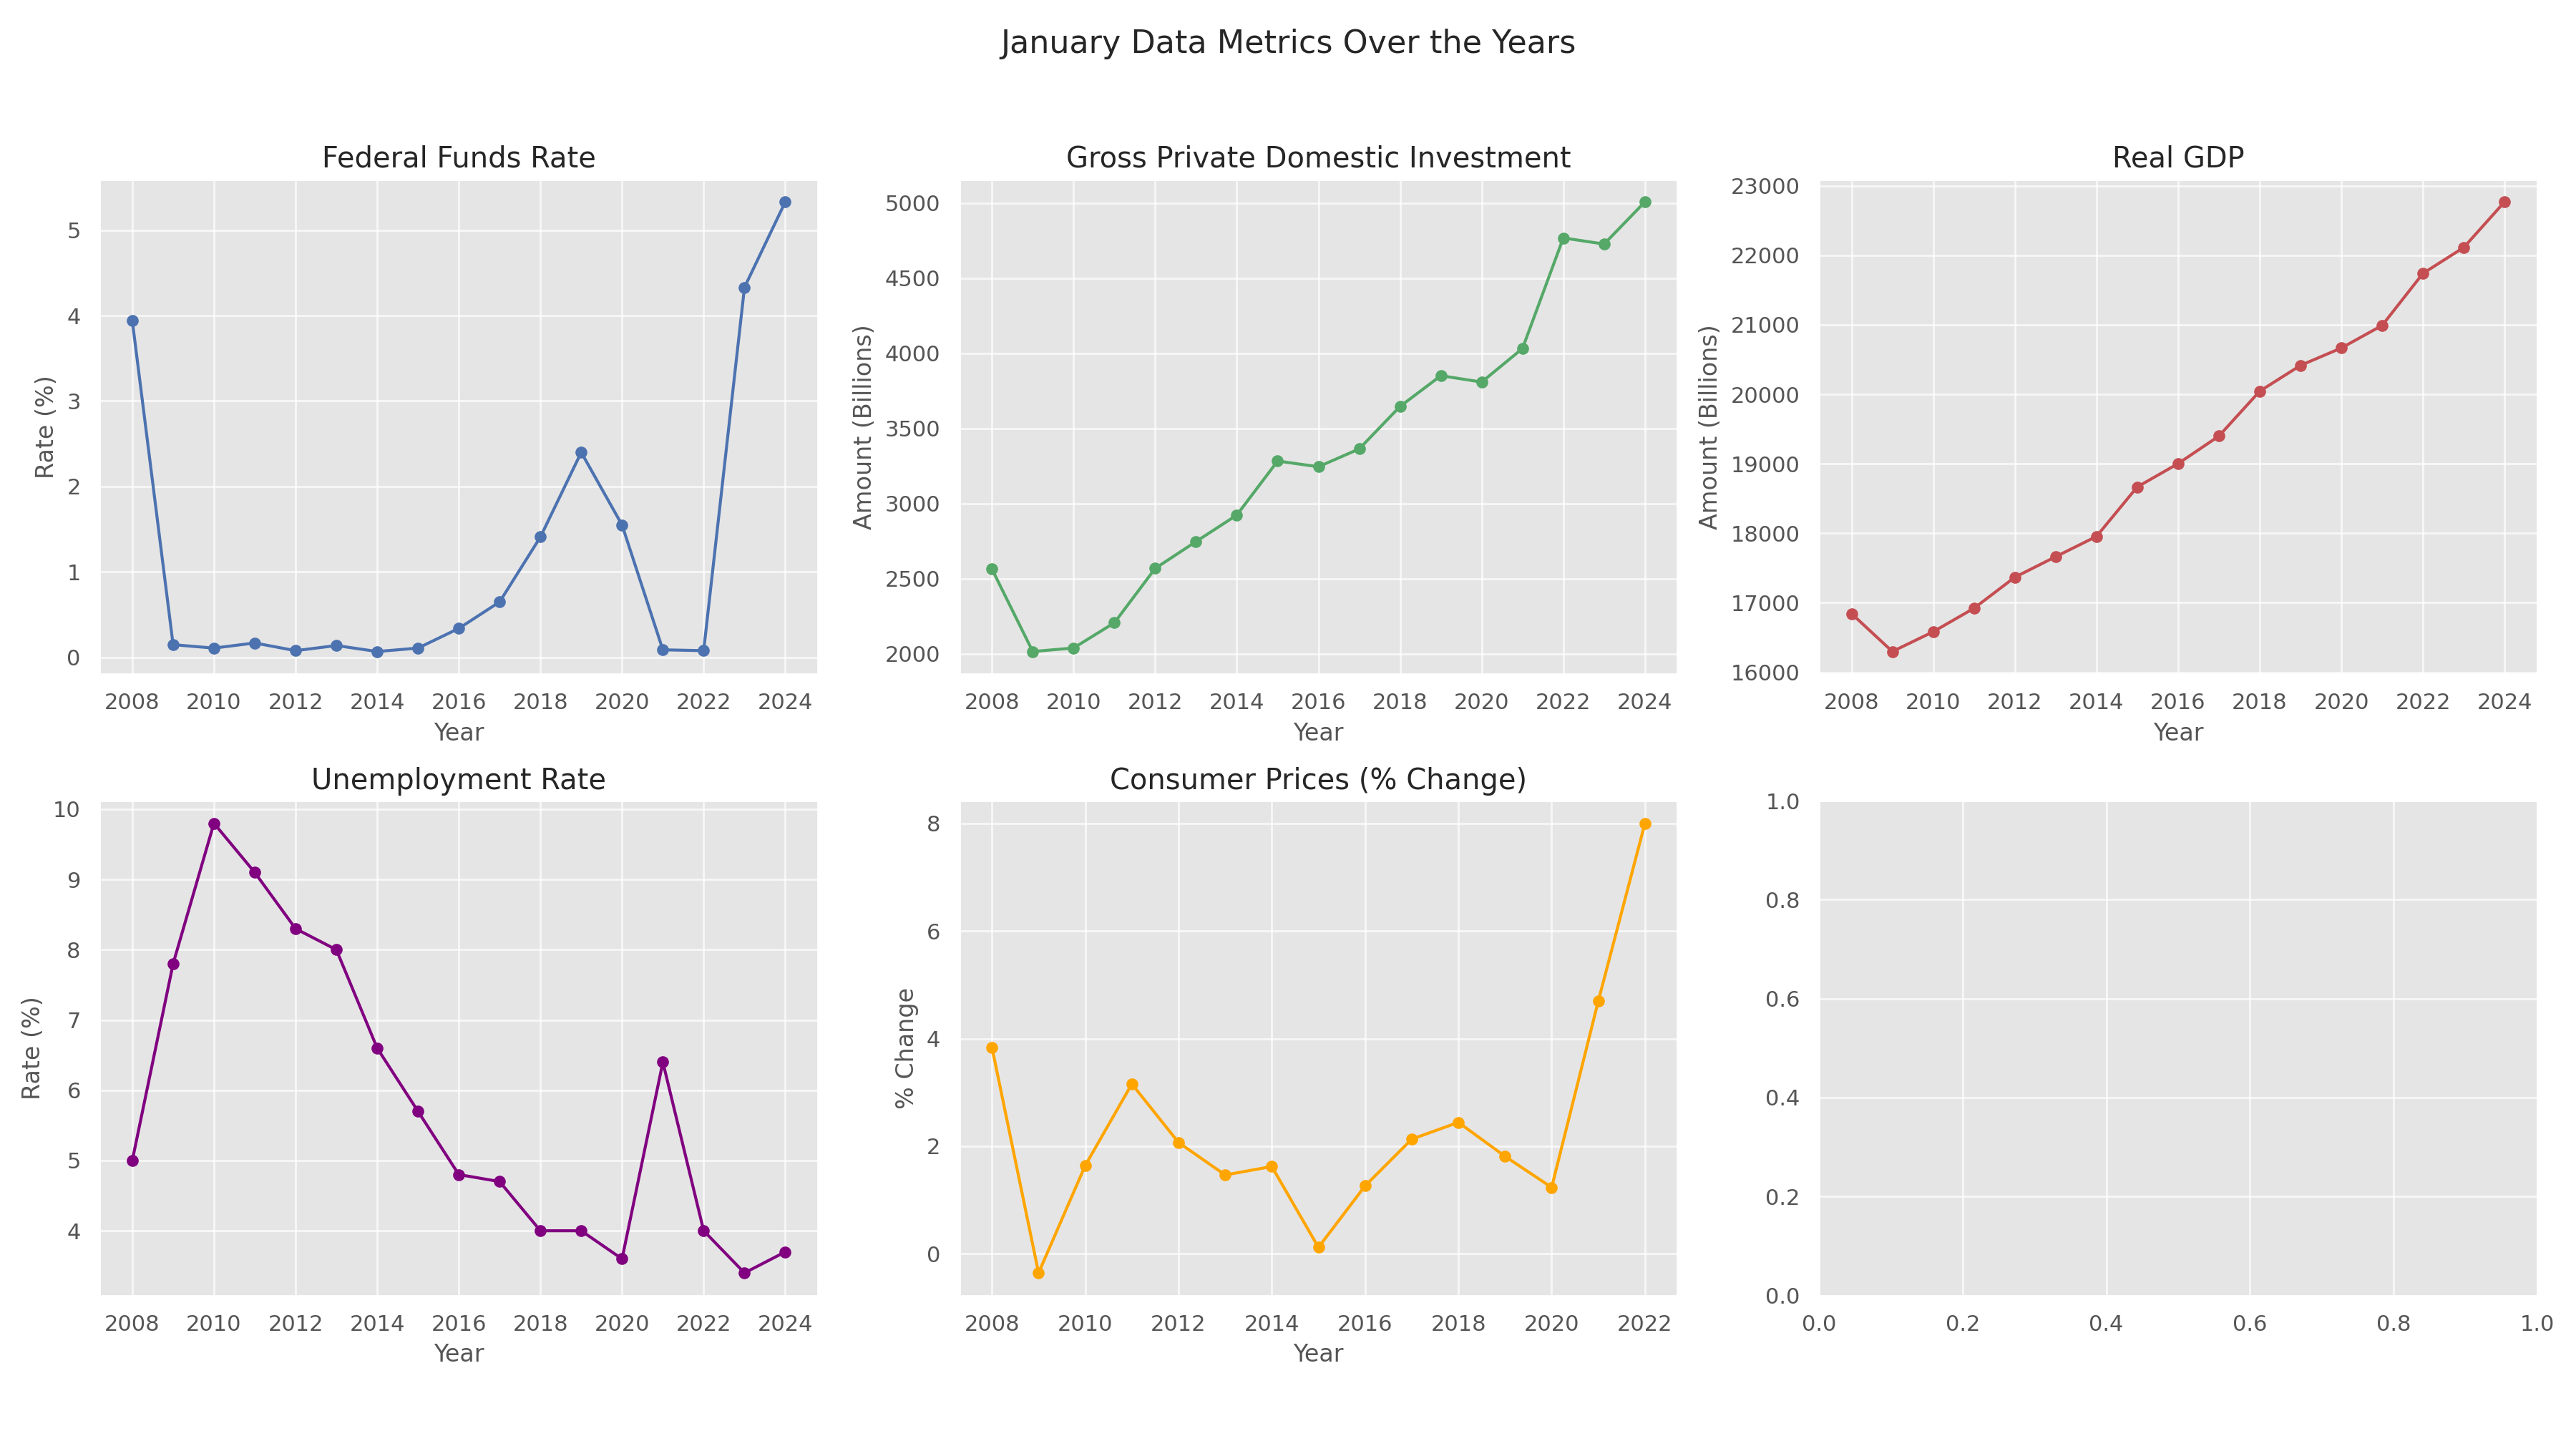
FRED DATA : Yearly, January 1st
| YEAR | DATE | FEDFUNDS | GPDI | RGDP | UNRATE | INFLATION |
|---|---|---|---|---|---|---|
| 2008 | 2008-01-01 | 3.94 | 2563.701 | 16843.003 | 5.0 | 3.839 |
| 2009 | 2009-01-01 | 0.15 | 2014.878 | 16298.262 | 7.8 | -0.356 |
| 2010 | 2010-01-01 | 0.11 | 2038.161 | 16582.71 | 9.8 | 1.64 |
| 2011 | 2011-01-01 | 0.17 | 2205.962 | 16920.632 | 9.1 | 3.157 |
| 2012 | 2012-01-01 | 0.08 | 2567.75 | 17367.01 | 8.3 | 2.069 |
| 2013 | 2013-01-01 | 0.14 | 2746.42 | 17662.4 | 8.0 | 1.465 |
| 2014 | 2014-01-01 | 0.07 | 2922.765 | 17953.974 | 6.6 | 1.622 |
| 2015 | 2015-01-01 | 0.11 | 3282.283 | 18666.621 | 5.7 | 0.119 |
| 2016 | 2016-01-01 | 0.34 | 3244.317 | 19001.69 | 4.8 | 1.262 |
| 2017 | 2017-01-01 | 0.65 | 3363.101 | 19398.343 | 4.7 | 2.13 |
| 2018 | 2018-01-01 | 1.41 | 3645.635 | 20044.077 | 4.0 | 2.443 |
| 2019 | 2019-01-01 | 2.4 | 3850.171 | 20415.15 | 4.0 | 1.812 |
| 2020 | 2020-01-01 | 1.55 | 3807.759 | 20665.553 | 3.6 | 1.234 |
| 2021 | 2021-01-01 | 0.09 | 4031.066 | 20990.541 | 6.4 | 4.698 |
| 2022 | 2022-01-01 | 0.08 | 4766.754 | 21738.871 | 4.0 | 8.003 |
| 2023 | 2023-01-01 | 4.33 | 4725.828 | 22112.329 | 3.4 | 3.400 |
Graph Yearly, January 1st
FRED DATA : Significant Changes
| Month/Year | Monetary Policy Action | Investment Spending | Unemployment Data | Inflation Data | Real GDP Data |
|---|---|---|---|---|---|
| Dec 2008 | Fed Funds Rate cut to 0.00-0.25% | Declined sharply to 2014.878 | Peaked at 10% in Oct 2009 | Near zero in 2009 | Contracted to 16298.262 |
| Dec 2015 | Fed Funds Rate raised to 0.25-0.50% | Modest recovery to 3282.283 | Declined to 5% by end of 2015 | Below 2% target | 18666.621 |
| Dec 2017 | Fed Funds Rate raised to 0.50-0.75% | Growth accelerated to 3363.101 | Dropped to 4.1% by end of 2017 | Below 2% | 19398.343 |
| Dec 2018 | Fed Funds Rate raised to 1.25-1.50% | Remained strong at 3645.635 | Fell to 3.9% by end of 2018 | Approached 2% target | 20044.077 |
| Dec 2019 | Fed Funds Rate raised to 2.25-2.50% | Growth slowed to 3850.171 | Remained low at 3.7% by end of 2019 | Below 2% | 20415.150 |
| Mar 2020 | Fed Funds Rate cut to 0.00-0.25% | Contracted sharply to 3807.759 | Spiked to 14.7% in Apr 2020 | Dropped significantly | Contracted to 20665.553 |
Python Matplotlib Code
import matplotlib.pyplot as plt

# Load the rounded datasets for plotting
jan_combined_rounded = pd.read_csv('/mnt/data/January_Data_Rounded.csv')
yearly_changes_rounded = pd.read_csv('/mnt/data/Yearly_Changes_Rounded.csv')

# Set up plotting parameters
plt.style.use('ggplot')

# Function to plot data from the January dataset
def plot_jan_data():
    fig, axes = plt.subplots(nrows=2, ncols=3, figsize=(18, 10))
    fig.suptitle('January Data Metrics Over the Years', fontsize=16)

    # Federal Funds Rate
    axes[0, 0].plot(jan_combined_rounded['YEAR'], jan_combined_rounded['FEDFUNDS'], marker='o', color='b')
    axes[0, 0].set_title('Federal Funds Rate')
    axes[0, 0].set_xlabel('Year')
    axes[0, 0].set_ylabel('Rate (%)')

    # Gross Private Domestic Investment
    axes[0, 1].plot(jan_combined_rounded['YEAR'], jan_combined_rounded['GPDI'], marker='o', color='g')
    axes[0, 1].set_title('Gross Private Domestic Investment')
    axes[0, 1].set_xlabel('Year')
    axes[0, 1].set_ylabel('Amount (Billions)')

    # Real GDP
    axes[0, 2].plot(jan_combined_rounded['YEAR'], jan_combined_rounded['GDPC1'], marker='o', color='r')
    axes[0, 2].set_title('Real GDP')
    axes[0, 2].set_xlabel('Year')
    axes[0, 2].set_ylabel('Amount (Billions)')

    # Unemployment Rate
    axes[1, 0].plot(jan_combined_rounded['YEAR'], jan_combined_rounded['UNRATE'], marker='o', color='purple')
    axes[1, 0].set_title('Unemployment Rate')
    axes[1, 0].set_xlabel('Year')
    axes[1, 0].set_ylabel('Rate (%)')

    # Consumer Prices Inflation
    axes[1, 1].plot(jan_combined_rounded['YEAR'], jan_combined_rounded['FPCPITOTLZGUSA'], marker='o', color='orange')
    axes[1, 1].set_title('Consumer Prices (% Change)')
    axes[1, 1].set_xlabel('Year')
    axes[1, 1].set_ylabel('% Change')

    plt.tight_layout(rect=[0, 0.03, 1, 0.95])

# Function to plot data from the Yearly Changes dataset
def plot_yearly_changes_data():
    fig, axes = plt.subplots(nrows=2, ncols=3, figsize=(18, 10))
    fig.suptitle('Yearly Changes in Metrics', fontsize=16)

    # Federal Funds Rate Change
    axes[0, 0].bar(yearly_changes_rounded['YEAR'], yearly_changes_rounded['FEDFUNDS'], color='b')
    axes[0, 0].set_title('Change in Federal Funds Rate')
    axes[0, 0].set_xlabel('Year')
    axes[0, 0].set_ylabel('Change (%)')

    # Investment Change
    axes[0, 1].bar(yearly_changes_rounded['YEAR'], yearly_changes_rounded['GPDI'], color='g')
    axes[0, 1].set_title('Change in Gross Private Domestic Investment')
    axes[0, 1].set_xlabel('Year')
    axes[0, 1].set_ylabel('Change (Billions)')

    # GDP Change
    axes[0, 2].bar(yearly_changes_rounded['YEAR'], yearly_changes_rounded['GDPC1'], color='r')
    axes[0, 2].set_title('Change in Real GDP')
    axes[0, 2].set_xlabel('Year')
    axes[0, 2].set_ylabel('Change (Billions)')

    # Unemployment Rate Change
    axes[1, 0].bar(yearly_changes_rounded['YEAR'], yearly_changes_rounded['UNRATE'], color='purple')
    axes[1, 0].set_title('Change in Unemployment Rate')
    axes[1, 0].set_xlabel('Year')
    axes[1, 0].set_ylabel('Change (%)')

    # Consumer Prices Inflation Change
    axes[1, 1].bar(yearly_changes_rounded['YEAR'], yearly_changes_rounded['FPCPITOTLZGUSA'], color='orange')
    axes[1, 1].set_title('Change in Consumer Prices')
    axes[1, 1].set_xlabel

# Plot for January data
plot_jan_data()
plt.savefig('/data/January_Data_Metrics.png')
plt.close()

# Plot for yearly changes data
plot_yearly_changes_data()
plt.savefig('/data/Yearly_Changes_Metrics.png')
plt.close()
Infographic
Public-View Canva Link - Infographic
Works Cited
FRED Data Links:
FEDFUNDS: https://fred.stlouisfed.org/series/FEDFUNDS
GPDI: https://fred.stlouisfed.org/series/GPDI
RGDP: https://fred.stlouisfed.org/series/GDPC1
UNRATE: https://fred.stlouisfed.org/series/UNRATE
INFLATION: https://fred.stlouisfed.org/series/FPCPITOTLZGUSA
Citations Links:
[1] https://tradingeconomics.com/united-states/interest-rate
[2] https://www.bankrate.com/banking/federal-reserve/history-of-federal-funds-rate/
[3] https://www.morningstar.co.uk/uk/news/239550/federal-reserve-holds-rates-full-analysis.aspx
[4] https://www.forbes.com/advisor/investing/fed-funds-rate-history/
[5] https://fred.stlouisfed.org/series/FEDFUNDS
MLA Citation:
Trading Economics. “United States Fed Funds Rate.” TradingEconomics, 2024, https://tradingeconomics.com/united-states/interest-rate.
Foster, Sarah. “Fed’s Interest Rate History: A Look at the Fed Funds Rate from the 1980s to the Present.” Bankrate, 22 Mar. 2023, www.bankrate.com/banking/federal-reserve/history-of-federal-funds-rate/.
Caldwell, Preston. “Federal Reserve Holds Rates: Full Analysis.” Morningstar UK, www.morningstar.co.uk/uk/news/239550/federal-reserve-holds-rates-full-analysis.aspx. Accessed 20 May 2024.
Adams, Michael. “Federal Funds Rate History 1990 to 2022.” Forbes Advisor, 17 Oct. 2023, www.forbes.com/advisor/investing/fed-funds-rate-history/.
Board of Governors of the Federal Reserve System (US), Federal Funds Effective Rate [FEDFUNDS], retrieved from FRED, Federal Reserve Bank of St. Louis; https://fred.stlouisfed.org/series/FEDFUNDS, May 14, 2024.
U.S. Bureau of Economic Analysis, Gross Private Domestic Investment [GPDI], retrieved from FRED, Federal Reserve Bank of St. Louis; https://fred.stlouisfed.org/series/GPDI, May 17, 2024.
U.S. Bureau of Economic Analysis, Real Gross Domestic Product [GDPC1], retrieved from FRED, Federal Reserve Bank of St. Louis; https://fred.stlouisfed.org/series/GDPC1, May 17, 2024.
U.S. Bureau of Labor Statistics, Unemployment Rate [UNRATE], retrieved from FRED, Federal Reserve Bank of St. Louis; https://fred.stlouisfed.org/series/UNRATE, May 21, 2024.
World Bank, Inflation, consumer prices for the United States [FPCPITOTLZGUSA], retrieved from FRED, Federal Reserve Bank of St. Louis; https://fred.stlouisfed.org/series/FPCPITOTLZGUSA, May 17, 2024.